

High-Value Touches help contextualize RB upside, and aren't difficult to predict
Including past results backing up the prediction claim, and 2025 Team HVT projections

When I wrote this column last year, I did a recap of the history of High-Value Touches as a stat, and what it means. I try to bring everyone new up to speed every year, but it does get super redundant for me, and I want to get working on the mailbag this morning. I’m going to quote last year’s introduction extremely liberally.
For those of you who don’t know, HVT refers to High-Value Touches, a term I coined at CBS back in 2019 to simplify something we all know about RB ceilings, particularly in PPR leagues: It comes down to receiving and goal-line work. I first did offseason content here at the newsletter in 2021, and I brought this column over after writing it at CBS in 2020. I brought it back in 2022 and again last year.
I will now do a quote within a quote. It’s quote-ception:
HVTs simply refer to all receptions, and then all touches inside the 10-yard line. I call that the “green zone,” for reference.
The 2021 version, my first time covering here at the newsletter, included a section with some key bullet points I’ve copied over each year, and will do so again.
Team HVT is not very sticky, but many of the biggest changes year over year were fairly predictable based on personnel changes. What it’s measuring is which teams threw to their backs and used their backs near the goal line.
Team HVT is a very good indicator of high-upside RB seasons. That is obviously a self-fulfilling statement because high-upside RB seasons have a lot of HVT, and they are high-volume pieces of those offenses. But particularly when we think about backups — think Mike Davis last year, or DeAngelo Williams and James Conner behind Le’Veon Bell years ago — the offensive system can be very beneficial. San Francisco finished highly last year, as did Washington, two backfields that had multiple very useful fantasy pieces.
One big part of Team HVT is the quarterback. Rushing QBs tend to throw to their RBs less frequently. Some QBs have always been goldmines for RB value (we’ll miss you Drew Brees and Philip Rivers).
From 2019, a section titled “Rethinking the word committee”: “I would argue a committee — as it pertains to fantasy — shouldn't be defined by how the overall touches are split up, but how the HVT are. That means that if a back is getting plenty of touches but giving up a few key goal-line touches, he may be in more of a fantasy committee than his touch count indicates. More notably, if an early-down back is only conceding five or six touches a game but those are all coming on passing downs, he's in a committee. He's losing high-value touches, and that's what matters.”
Later in that section: “But we also have more of a tolerance for some players in committees than others. Alvin Kamara is a top-three pick despite not projecting to be a workhorse. Why is that? Because his offense generates an absurd amount of HVT.”
Third time’s a charm: “It's the HVT that's the key. If you are looking to draft a running back who may cede high-value touches, his offense better at least be able to generate a lot of them overall. Teams high on this list can support multiple backs; teams near the bottom that may have a committee should be avoided.”
That’s the short of it, but I still recommend clicking through the links above and reading some of the other insights over the years. One key thing is we’re not using last year’s data, we’re predicting this year’s. Some people can’t get their minds around this idea in the current fantasy landscape — it has to be provable in past data or isn’t valid, despite all the football stats not being sticky which tells us we can expect change (if you want to zoom out for a minute to something abstract, follow that link; not gonna lie, I was cooking in that post).
The value of Team HVTs
I went on to write another section, called “The value of Team HVTs,” and it’s on to more quote-ception:
When I wrote the 2021 piece, I referenced the below quote from the 2020 piece, then said “This is more or less common knowledge at this point, but is always important to reiterate.”
In PPR formats, there is a clear formula to identifying running back upside — receptions plus goal-line work. It really is that simple. Any back who catches a lot of passes and has touchdown potential has a far easier path to upside than one who doesn't.
But one of the fascinating things with fantasy analysis is how it’s sort of always turning over, with new data and fresh perspectives, and different things can go in and out of popularity with different emphasis. In last year’s post, I talked about how both receptions and RB green zone touches were down in 2022. I’ve also noticed a distinct rise in half-PPR scoring use even in home leagues, no doubt in part due to the popularity of Underdog best ball leagues, and HVTs are definitely less of a cheat code in half-PPR.
[Going off on this tangent a bit, even in half-PPR, receptions are still quite a bit more valuable than “low value” rush attempts, and guys who don’t catch enough balls still have a bit of a statistical cap on how legendary their upside can be. But one of the things I’ve come to appreciate about HVTs (as a stat) is the balance between green zone touches being worth more than receptions, but receptions being far easier to predict, largely because team goal-line snaps are not particularly sticky (as opposed to our ability to predict which RB might get a high percentage of the work). I don’t know where I wrote it, and I have so much content at the newsletter now that the search function no longer serves its purpose sometimes, but I once broke down how Dalvin Cook’s high rate of green zone touches was an anomaly on the team level, showing how offenses don’t carry their rate of snaps inside the 10-yard line year over year. Anyway, the TDs do matter more, but the receptions are easier to predict, and it’s a nice blend to consider them together.]
Back to the main point. This way of thinking has gone by the wayside a bit for a couple reasons, but one was HVTs were dropping. They did rebound last year, both in terms of receptions and RB green zone touches.
Here, I shared a visual that included HVTs per game on the team level, and broke that down to green zone touches per game and also receptions per game. I’m going to add that visual now, but with 2024 included. (Note: These things don’t perfectly add up because there’s some double counting; receptions per game includes green zone receptions, and green zone touches per game also includes green zone receptions.)
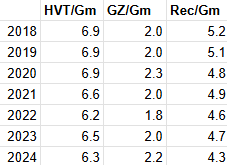
As you can see, my optimism that HVTs were rebounding in 2023 did not carry over to 2024. That trend helped emphasize the profiles of explosive-play runners like Saquon Barkley, who is not a HVT king or anything, but obviously didn’t need to be in a landscape like 2024.
And yet. It doesn’t negate that RBs who amass a ton of HVTs can reach scoring ceilings other players can’t. I went on to write this:
One of the things I found in the earlier years was that a lot of the valuable usage notes came from the outlier teams, i.e. understanding which teams could be HVT goldmines and which might really limit the upside of the backs. This is often true of team-level data, where the value is not in the differences between the 20 or so teams in the middle, but the handful on each tail end.
And I think that plays into the league-level trends, especially with receptions. We used to have a handful of teams that would really bring up the average. In the above quote from 2021, I was bummed about losing Philip Rivers and Drew Brees due to their propensity to pass to RBs at a high rate, and we’ve since also lost Tom Brady and other pocket passers like Joe Flacco, who popped back up last year and was a checkdown king…
I think this was very prescient, and I genuinely think part of the issue in 2024 was the NFL losing Christian McCaffrey, then De’Von Achane being an HVT god when Tua Tagovailoa played and a peasant when he didn’t, as Tua played just 11 of 17 games so we didn’t get the full Achane HVT boom season, then also the Broncos’ RBs being subpar talents who couldn’t do everything Sean Payton wanted them to do.
We do have more mobile QBs, which has also hurt the overall average, as the league is not packed with the Rivers and Brees and Brady types anymore. We do need to consider other ways RBs can score points and hit ceilings which is something you may have seen in Shawn Siegele’s work this offseason.
But it doesn’t mean HVTs aren’t valuable. And in fact, the possibility exists that if a couple teams pop up as HVT factories, they are so much better than the average team that isn’t generating big HVTs, that they are massive targets.
I hit on this in an erratically-written addition to my HVT post from last year, which I put into the post a day after it published and many of you who only interact with these posts via email wouldn’t have seen.
[Edited to add: I failed to address a specific point I wanted to make, and wanted to circle back and include here, the day after this post was published. As I referenced with commentary about how data goes in and out of popularity, what I’ve found to be more heavily referenced in the past couple years is backfield share, and snap share, and these types of benchmarks, and what I wanted to emphasize (and I think mostly did in this piece) is the size of the pie is still super relevant. If you’re hyper-focused on whether your guy is getting 75% or 65% of his backfield, and missing the size of the backfield as a whole, you’re missing a huge percentage of the picture. And as things in the fantasy space have gotten exceedingly focused on the individual player profiles, I do believe this is a real issue across the whole space.
…
That’s the point I want to emphasize. Think about it for a second. It is so easy to hyper-focus on a player who “only” gets 50% of his backfield, and love one who gets 75%, but if the guy getting 50% of his backfield is on a team that generates 200 RB fantasy points over some span and the other is on one that generates 100, you’re talking about 50% guy meaningfully out-producing 75% guy, 100 to 75. And in situations like that, you’d far prefer the player who has meat on the bone with his usage share. The 75% guy has to get to literally 100% just to match the 50% guy, unless the team starts scoring more RB points (and the RB is in control of this to some degree, which is why we talk about efficiency). But if the 50% guy just gets to 60% for a stretch because his backfield mate is dinged up, suddenly he jumps to the equivalent of 120 points out of his team’s 200-point pie.
The logical endpoint of this, by the way, is that we just look at the player’s role, and that focusing too much on his percentage of his backfield misses the other key context — what is that a percentage of? — and it’s probably an example of “advanced” ways of looking at things not actually improving the way we understand the players.
That was supposed to be a major point of this post, was that many in the industry focus so much on the backfield splits, and miss the forest for the trees in terms of how big the overall size of the team’s backfield value is. And I did — or will — hit on that idea a little bit, where I talked about committee backs in an offense that generates a ton of HVT being independently strong fantasy plays...]
I love that example about a team with a 200-point RB pie and one with a 100-point pie, and if you don’t think that’s possible, I was citing work from Siegele where Miami in 2023 had literally doubled up other teams in RB fantasy points.
I do think that kind of a team-level gap could exist again in the future. Most of what I’m sharing about my past writeups is because there’s a level here to understanding how the NFL is evolving, and why that’s made HVT volume less necessary for big RB upside. But the related element is if you got historical HVT upside here in 2025, you could move mountains.
Before we get to the 2025 predictions, let’s reflect on the specific predictions in 2024’s version of this post.
2024 results
By request, I started predicting Team HVTs, using my projections, for the first time in 2023. Here was my process.
I figured it would be pretty well baked into my team projections, in that I could just take the projected RB receptions and then also a generic rate of leaguewide green zone rushes per rushing TD, and use my rushing TD projections to predict a loose green zone rush attempt figure (I used total rushing TDs, not just green zone rush TDs, figuring the rate of explosive rush TDs would likely balance somewhat, and for the 2022 season that came to 2.7 RB green zone rushes per total RB rush TD).
In 2023, I shared the top five and bottom five offenses from those projections, focusing on the tail ends, because of what I’d written above about the value probably being more on the extremes than in smaller differences in the middle 20 or so teams.
That’s relevant because it brought about an interesting reality in the results.
What’s wild is while there was plenty of variance between my projections and the actual numbers — they correlated at an r-squared of about 0.2, which isn’t strong, but fits what we know about how hard projecting team-level volume can be — the tail end analysis held up.
There was some variance, but of the teams I projected at the top, when the projection was off, that just put them in the middle of the pack, not near the bottom. Of the teams I projected at the bottom, when the projection was off, that just put them in the middle of the pack, not near the top. The high-end teams didn’t have low floors, and the low-end teams didn’t have high ceilings.
Of my top eight highest-projected teams in HVTs — a quarter of the league — the lowest any of them finished was 20th. None of them finished in the bottom 12 teams.
Of my bottom eight lowest-projected teams — another quarter of the league — the highest any of them finished was 14th. None finished in the top 13 of the league.
I shared a whole table with all the results from 2023 relative to the actual data, including some discussion of the biggest misses. I then, obviously, shared my 2024 predictions, including a handful of team-by-team notes that I thought were most relevant, which is how I’ve always looked at the Team HVT stuff, even before doing explicit projections for them.
I’m going to do all that now for 2024, including referencing some of the context I mentioned in the team-by-team writeups. (For example, in a writeup on the 49ers being a good HVT team, I wrote, “For San Francisco, things changed when they acquired Christian McCaffrey, and he’s a unicorn that drives his team’s HVT numbers.” This is a massive part of why, when CMC went to IR, I wrote a whole standalone piece after Week 1 called, “The 49ers offense is going to look way different than expected.” Not having CMC in the S.F. offense changed everything.)
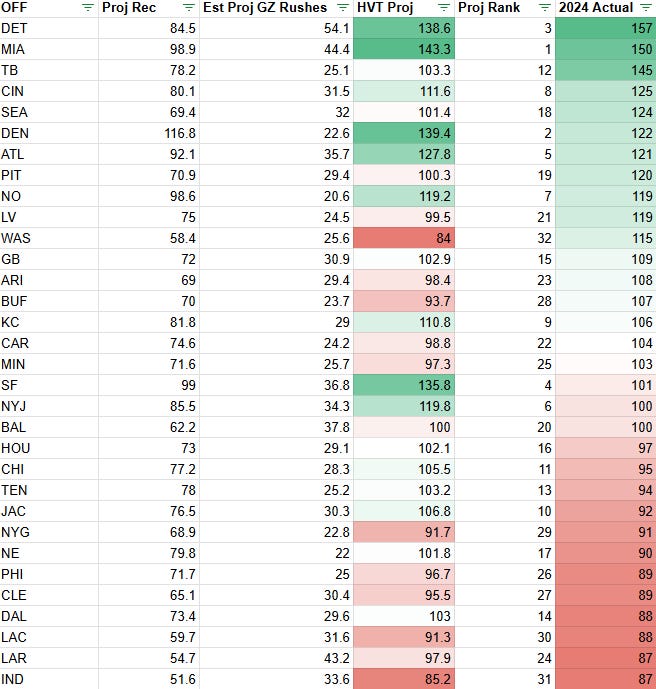
Here are last year’s projections versus the actual results, sorted by actual Team HVTs from 2024 (I’ll share this in spreadsheet form below).
The tail end results were even stronger than last year, save for a couple decent-sized misses. Using the same sort of statements as I made last year (when reviewing 2023) about the top quarter and bottom quarter of the projections, I could say these things.
Of my eight highest-projected teams in HVTs — a quarter of the league — the lowest any of them finished was 19th.
Of my eight lowest-projected teams in HVTs — another quarter of the league — the highest any of them finished was 11th.
The team that finished way above projection was Washington, and Jayden Daniels really impacted the whole offense. They were still near the bottom of the league in receptions, but were top three in the NFL in RB green zone rush attempts per game. My projected touchdowns for these offenses tether to market expectations, but RB value is going to spike when an offense scores way more touchdowns than the market foresees, which is what we got from the Commanders in 2024.
Considering that note, and the San Francisco miss being related to injury, I’m pretty shocked at how good the rest of these projections are. Each of the top three teams in the projections finished in the top six, and then the fifth-highest projection finished seventh. Both the top two teams in actual Team HVTs were top-three projections.
At the bottom end, Washington was projected dead last and was much better than that, but both teams projected 30th and 31st finished in the bottom three leaguewide. The teams projected 26th, 27th, and 29th were all in the bottom quarter of the league, meaning the bottom eight teams included five of the eight teams projected to finish there (and also one more team projected to finish ninth from the bottom, or 24th, who actually finished 31st).
These results increase the strength of my belief that we can pretty accurately predict Team HVTs based on forward-looking elements that factor into the projections process, like player movement and market scoring expectations.